March 21, 2012
Well, not quite. While Asians were the fastest growing racial group in the U.S. between 2000 and 2010, they still make up only about 5% of the population. This is according to the a new Census brief released today, The Asian Population: 2010.
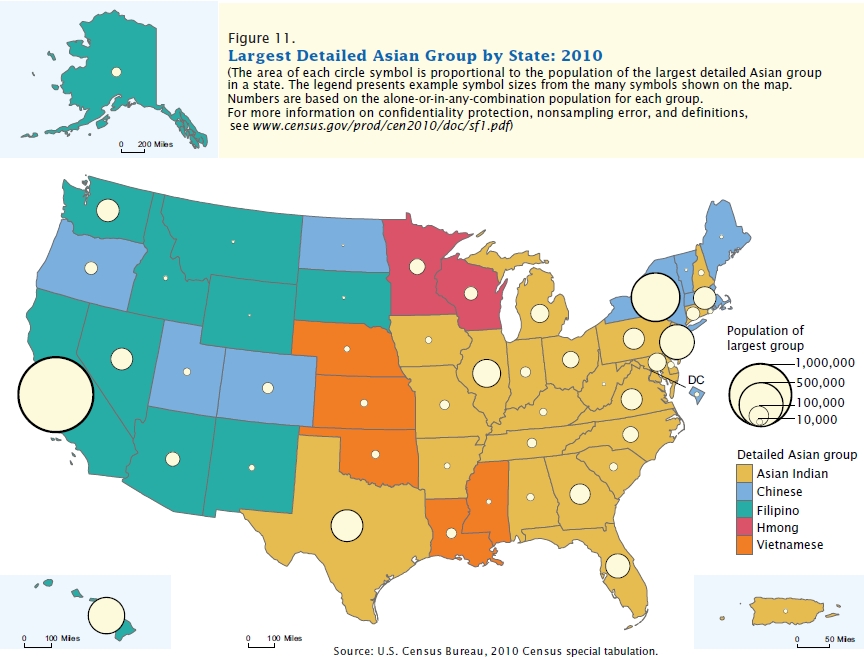
This brief is features several colorful maps and graphs showing the U.S. Asian population in states, cities, even counties. It also has an interesting discussion of “race alone-or-in-combination concepts” and multiple race reporting, reflecting how the Census has been evolving over the past decades along with our racially-diversifying population.
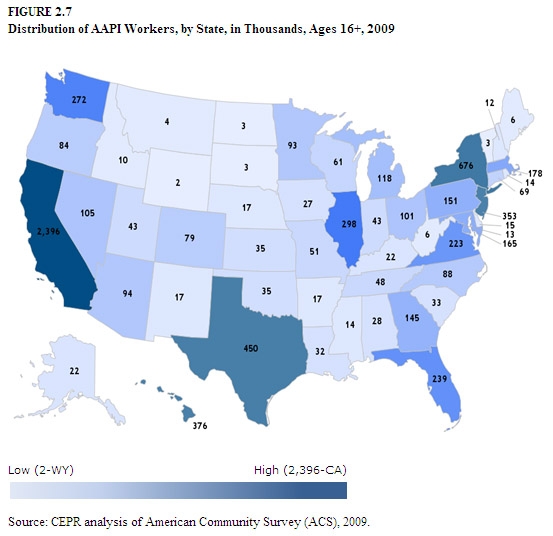
This useful new Census brief confirms what CEPR found last year in our report, Diversity and Change: Asian American and Pacific Islander Workers. The Census brief is based on the 2010 Census data, while most of CEPR’s analyses were based on the 2009 American Community Survey. Also, CEPR’s report looks at AAPI workers, while Census looks at the overall Asian population (and does not include Pacific Islanders, unless in combination with Asian, in this brief). Still our findings match up very well.

Some small differences occur when looking at states. While the 9 states with the largest Asian population match perfectly (CA, NY, TX, NJ, HI, IL, WA, FL and VA), Census ranks Pennsylvania 10th, while CEPR ranks it 12th. In 10th and 11th places in CEPR’s report are Massachusetts and Maryland, respectively.
And CEPR’s report looks at several aspects that the Census brief doesn’t get to, such as immigration status, country of birth, educational attainment, industry, unemployment, home ownership, disabilities and unionization. However, Census says that over the coming decade, it “will release additional information on the Asian population.” Stay tuned!


