June 05, 2012
June 5, 2012 (Housing Market Monitor)
By Dean Baker
Age-adjusted homeownership rates are far below their levels of 4 decades ago.
There is growing evidence that the housing market has finally bottomed out and that prices may finally begin rising again. For the first time since the collapse of the bubble, virtually all the data are pointing in the same direction. While some markets may still have some air in their bubbles, the nationwide trend in house prices is likely to be upward. However, this means that house prices are likely to follow their usual pattern of rising in step with inflation; there is no reason to expect a return to anything like the bubble prices of the last decade.
The most striking item in recent data releases was the sharp drop in vacancy rates that the Census Department reported for the first quarter. The vacancy rate in ownership units fell from 2.6 percent in the first quarter of last year to 2.2 percent. It had been as high as 2.9 percent. The pre-bubble vacancy rates were typically less than 1.7 percent. The vacancy rate for rental units was 8.8 percent, down from a peak of 11.1 percent. Historically rental vacancy rates have typically been in the 7-8 percent range.
These data suggest that underlying supply and demand in the housing market are not far out of balance. This may mean not only a turnaround in prices, but also some rise in construction as well. This would be in keeping with the higher measures shown recently in the National Association of Homebuilders’ index.
The data on existing home sales presents a similar picture. April sales were the second highest for the last year. More importantly, the ratio of inventory-to-sales has been under 7 months since December, a normal level. There was also a sharp jump in both the median and average sales prices reported for April, but this was most likely an aberration in an erratic series.
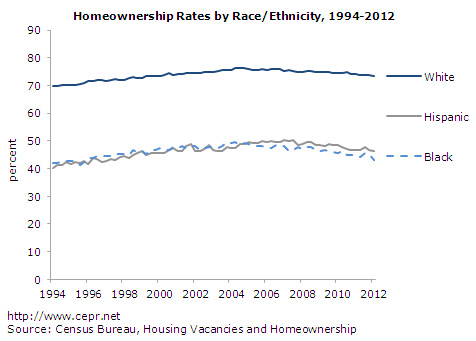
In contrast to the positive news on the vacancy rate, the Census Department release had some negative news on homeownership rates. The 65.5 percent homeownership rate was down a full percentage point from the year-ago-rate. This is down almost four full percentage points from the peak in the second quarter in 2004 and is the lowest level since the fourth quarter of 1998.

The homeownership rate for African Americans has fallen even more sharply, standing at 43.1 and down by 5.5 percentage points from the 48.6 percent peak in the third quarter of 2006. This is lowest rate of homeownership for African Americans since the 4th quarter of 1995.
On an age-adjusted basis, the homeownership rate is far below its levels of the 70s. The homeownership rate in the 70s peaked in the third quarter of 1979 at 66.0 percent before the recession drove it lower. This was a time when the baby boom cohort was between ages 15 and 33. By contrast, the baby boom cohorts are now between the ages of 48 and 66, their peak homeownership years.
The Case-Shiller 20-City Index in March edged up by 0.1 percent, its second consecutive increase. Prices declined in only four of the twenty cities. The sharpest decline was a 2.1 percent drop in Detroit, with prices also dropping by 0.6 percent in Chicago, 0.4 in Atlanta, and 0.2 percent in New York.
There continue to be substantial differences across segments of the market. The bottom tier of the market, which had been hardest hit with the collapse of the bubble, is now showing some strength in many markets. In Miami, prices in the bottom tier have risen at a 9.6 percent annual rate in the last three months, in Minneapolis by 17.3 percent, and in Phoenix by 66.8 percent.
By contrast, prices for homes in the bottom third of the market have fallen at a 10.5 percent annual rate in Boston and a 15.8 percent rate in New York. Both of these markets still have some room for price declines.
Going forward, housing is likely to be a positive force in the recovery. While there is not likely to be a housing boom, the general direction of residential construction will be upward, providing an important boost to the economy.


