October 29, 2013
October 29, 2013
by Dean Baker
Due to lags in major data sources we do not have an unambiguous picture of the housing market. However, the most recent data continues to support the view that the market has slowed substantially following the rise of mortgage interest rates in June and July. It appears that this increase in rates, which followed immediately from Federal Reserve Board Chair Ben Bernanke’s discussion of plans to taper off the pace of quantitative easing, had the effect of bursting the incipient bubbles that were developing in many markets.
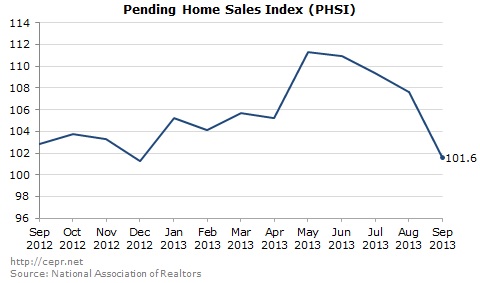
Evidence in support of this view can be found in the pending homes sales data, the mortgage applications index, and the existing home sales data. The pending home sales figures probably give the clearest evidence of slowing. These numbers reflect contracts signed. Pending sales reported for September were down 5.6 percent from August and by 1.2 percent from the year-ago level. They are down 8.7 percent from the peak hit in May.
This pattern fits well with the view that sales had been rising sharply until the Fed-induced rise in mortgage interest rates scared away many buyers, especially investors. The drop was sharpest in the west, which includes many of the markets in which bubbles were at risk of developing (e.g. Phoenix, Las Vegas, the central valley in California). September sales were down by 9.0 percent from August levels and 9.8 percent from their year-ago level. Sales in the West are down by 14.8 percent from a June peak.
The weekly mortgage applications index tells a similar story of weakening demand. Earlier in the year, purchase applications were running 7-9 percent above year-ago levels. In the last few months, they have generally been close to even with year-ago levels. Mortgage applications only give a partial picture of the market since many investor properties will not be financed through mortgages.
The existing home sales index declined in August after being flat in July. This index had been rising rapidly earlier in the year. It still stands 10.7 percent above year-ago levels. This index is less useful as a measure of the state of the housing market because of the lengthy lag between contracts and sales. A slowdown in contracts signed in July would only be partially reflected in the August data, with many of these sales not closing until September. It is worth noting that both the average and median sales prices in these series have fallen sharply in the last two months. However, since these numbers are highly erratic, this could just reflect random movements or a change in the mix of sales. In August, sales were running at 5.3 million annual rate; which is still probably a bit above the pre-bubble trend.
The major data source going opposite this picture of a slowing market is the Case-Shiller index. This continued to show strong price appreciation as the 20-city index rose 0.9 percent in August, with all 20 cities showing price rises. The index is now 12.8 percent above its year ago level. These data have a larger lag than the other series since they are based on a 3-month average of sales prices. This means that the latest data reflect sales in June, July, and August, which would in turn be based largely on contracts signed in April, May, and June. That means that the series would be expected to show little evidence of a slowdown that began in July.
The western cities continued to show the largest price increases with Las Vegas topping the list with a 2.3 percent monthly rise, followed by Los Angeles with a 1.7 percent increase and San Diego with a 1.6 percent increase. Over the last year, prices in these cities have risen by 29.2 percent, 21.7 percent, and 21.5 percent, respectively. As has been the case throughout the last year, these sharp prices rises have been driven largely by the bottom third of the housing market. In Las Vegas, prices in the bottom tier rose 4.2 percent in August and were up 48.5 percent from year ago level. The Fed’s taper talk may have brought this boom to an end, but we will need more data to be certain.


