March 29, 2011
March 29, 2011 (Housing Market Monitor)
Plunging new homes sales are a necessary part of the adjustment process.
By Dean Baker
The Case-Shiller 20-City index fell by 1.0 percent in January, the fourth consecutive month where it has fallen by at least 1.0 percent. It is now down by 5.4 percent from its peak in July. Nineteen of the 20 cities had a drop in prices. The exception was again Washington, D.C. where prices edged up by 0.1 percent. Prices are now down by 3.1 percent from their year-ago-levels. In nominal terms, prices are still 1.1 percent above their previous post-bubble low in April of 2009; however, in real terms they are already 2.2 percent lower.
Seattle and Portland continue to rank near the top for largest price declines, with prices falling by 2.4 percent in January in Seattle and by 1.8 percent in Portland. Over the last three months prices have fallen at an annual rate of 19.9 and 16.3 percent respectively in the two cities. The bubbles in these cities are finally deflating after prices held up better than in most other bubble regions. There is little reason to expect this decline to slow soon.
The Midwest cities continued to see sharp declines. Prices in Minneapolis fell by 3.4 percent, in Chicago by 1.8 percent and in Detroit by 1.7 percent. Over the last three months, these cities have seen annual rates of price decline of 24.6 percent, 19.6 percent and 17.3 percent, respectively. In Minneapolis and Chicago, these price declines reflect the continued deflation of a bubble. In Detroit, the price decline reflects the devastation of the economy. It seems likely that the rate of price decline in Minneapolis and Chicago will lead these markets to overshoot on the low side in the correction process.
The California cities are also continuing the process of deflating their bubbles. Prices in January fell by 0.6 percent in Los Angeles, by 1.2 percent in San Diego, and by 1.7 percent in San Francisco. The annual rate of decline over the last three months in these cities was 9.2 percent, 7.2 percent, and 14.9 percent, respectively. These declines may accelerate as the impact of the state’s homebuyer tax credit fades.
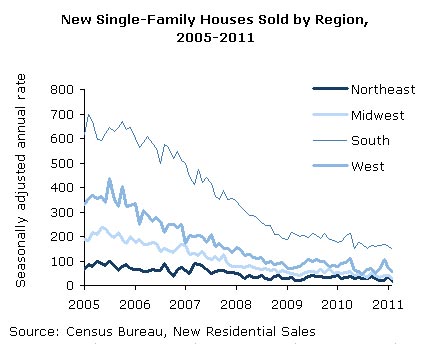
The plunge in new home sales in February caught the attention of many reporters and housing analysts. The 250,000 annual rate of sales reported for the month is by far the lowest on record and is down by more than 80 percent from levels reported in 2005 near the peak of the bubbles. The decline in new home sales have been even more severe in the West and Midwest, where they are down by 87 and 88 percent, respectively from their bubble peaks.
While these declines are dramatic, they are not unexpected. The bubble prompted an enormous building boom, which led to a massive over-supply of housing. A major part of the correction process must be a sharp reduction in the homes being built each year, which we have seen. The February number for starts of single-family units was down almost 80 percent from the peak of the boom. After a period of weak construction, supply and demand will eventually come back into balance.
 Sales of existing homes really don’t play any role in the adjustment process except in lowering prices, which is the signal for builders to reduce construction. The turnover of existing homes doesn’t affect the availability of homes, just the families who occupy them. This will always be primarily determined by factors like job turnover, changes in family structure, and growth in income. The immediate state of the economy and interest rates will be a factor in the rate of turnover, but a relatively small one compared with these other factors. There is no way that we could experience the same sort of decline in existing home sales as we have seen in new home sales regardless of how bad the economy is.
There can be little doubt that the housing sector will continue to be a drag on the economy through 2011. Construction has hit bottom, but prices are virtually certain to fall through much of the year, further depressing consumption.


