March 26, 2013
March 26, 2013 (Housing Market Monitor)
By Dean Baker
Prices for bottom-tier homes rose at a 64.6 percent annual rate over the last quarter.
The Case-Shiller 20-City Index rose by 1.0 percent in January, its 12th consecutive monthly increase. Prices are now up by 8.1 percent from their year-ago levels and have risen at a 10.8 percent annual rate in the last three months.
Prices in all 20 cities rose in January. San Francisco and Phoenix showed the strongest gains at just over and under 1.9 percent, respectively. The next largest gains were 1.8 percent in Atlanta and 1.7 percent in Las Vegas and Tampa. The weakest growth was in the Northeast and Midwest. Prices in Detroit rose by just 0.2 percent, while prices in Washington, D.C., and Boston both rose by 0.4 percent. Prices in New York and Chicago both rose by 0.6 percent.
This pattern continues a split in the housing market in these data. Prices in many of the former bubble markets have been rising rapidly. For example, prices in Phoenix have risen 23.2 percent from year-ago levels, while prices in San Francisco are up 17.5 percent and in Las Vegas 15.2 percent. By comparison, prices in Boston, Washington, and New York are by 4.0 percent, 6.0 percent, and 6.7 percent, respectively.
The rapid price increases in these former bubble markets are in turn driven by rapid price growth in the bottom tier of the market. Prices for homes in the bottom third of the Phoenix market rose 2.4 percent in January and are 41.0 percent from year-ago levels. In Las Vegas prices for bottom-tier homes rose 3.1 percent. They are up 26.6 percent over the last year but have risen at a 39.5 percent annual rate over the last three months. Prices for homes in the bottom tier in San Francisco rose 2.0 percent in January and up are 20.8 for the year. In Atlanta prices rose 5.6 in January and have risen at an incredible 64.6 percent annual rate over the last three months. By contrast, in Boston prices for homes in the bottom tier rose by just 5.8 percent over the last year while in New York they fell by 3.0 percent.
As noted previously, the run-up in prices in the bottom tier of these markets is not necessarily cause for concern, since prices had fallen so precipitously during the downturn. However the rate of increase is alarming. Certainly this cannot be sustained for any substantial period of time. At the moment it is being driven in most of these markets by investor purchases. With rents in no way keeping pace, the fundamentals in these markets will not support much higher prices. This could end badly for homeowners who may again be buying into a bubble.
Other housing data continue to be overwhelmingly positive. February new home sales were down somewhat from January but were still 12.3 percent above their year-ago level. There was a similar story with existing home sales, which edged up slightly from January’s levels. Existing home sales for the month were 10.2 percent above year-ago levels. February housing starts were up 0.8 percent from January and 27.7 percent from year-ago levels. Single family starts were up 0.5 percent for the month and 31.5 percent from year-ago levels.
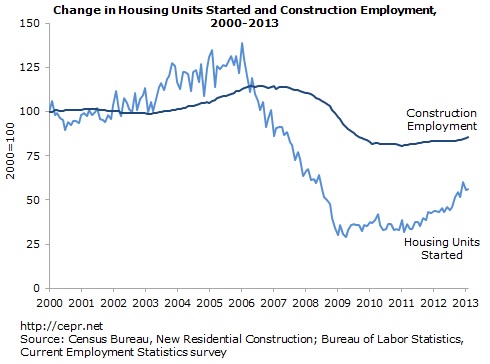
While this come back in housing is impressive, it is important to realize that the rapid growth is starting from very low levels. Starts peaked at over 2 million in 2005; the 917,000 annual rate for February was still less than half of the bubble level. It is reasonable that starts will continue to increase over the course of the year, as vacancies are falling back to more normal levels. However the vacancy rate still remains at unusually high levels. Furthermore, it is not plausible that starts will go back to their bubble pace.
It is worth noting that the rise in starts is not likely to lead to a boom in construction jobs. Many construction jobs involve informal labor, which is never recorded as paid employment. (Many workers are undocumented.) For this reason, construction employment did not follow closely on starts in either the boom or the bust.


