November 18, 2009
November 18, 2009 (Prices Byte)
By Dean Baker
November 18, 2009
Used car prices rose at a 30.8 percent annual rate over the quarter.
The CPI rose by 0.3 percent in October while the core index increased 0.2 percent. Over the last quarter, the overall CPI has increased at a 3.6 percent annual pace. By comparison, over the last year it has fallen 0.2 percent. The core index has increased at a 1.4 percent annual rate, down slightly from its 1.7 percent rise over the last year.
The glut in housing continues to be a major factor restraining inflation. The index for rent proper fell by 0.1 percent in October, while the index for owners’ equivalent rent (OER) was flat. Over the last quarter, the rent proper index has declined at a 0.7 percent annual rate, while the index for OER has fallen at a 0.3 percent rent. Together these two components account for 30.4 percent of the overall CPI and 39.1 percent of the core index. Excluding these two housing components, the core CPI rose at a 2.5 percent annual rate over the last quarter. Rather than showing a slight deceleration, the core index would be showing a modest acceleration if not for the glut in housing.
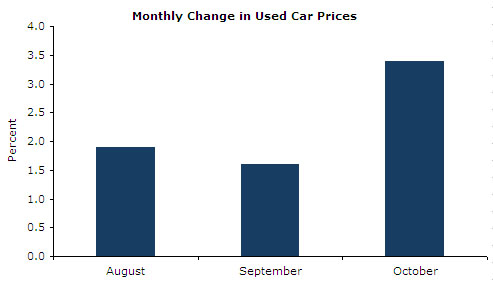
One of the items pushing the core CPI higher over the last quarter was the rise in used car prices. With the Cash for Clunkers program pulling hundreds of thousands of trade-ins out of the stock of used cars, it was inevitable that there would be some rise in price. Used car prices rose 3.4 percent in October and have risen at a 30.8 percent annual rate over the last quarter, adding 0.6 percentage points to the core rate of inflation over this period. (It is important to remember that most used car buyers already own a used car and therefore are helped by the rise in price. The only losers are first-time buyers.) New car prices have also risen somewhat more rapidly than the core index, increasing at a 2.8 percent annual rate over this period.

Medical care costs rose 0.2 percent in October and have risen at a 3.6 percent rate over the quarter. Drug prices have gone up at 5.0 percent annual rate over the quarter, compared to a 4.7 percent rate over the last year. Education costs have moderated somewhat recently, rising at just a 3.4 percent rate over the last quarter, compared to a 4.9 percent rate over the year. The category water and sewer and trash collections is pushing up inflation, rising 0.8 percent in October and at a 8.3 percent rate over the last quarter. The sharp increases in this category are presumably the result of efforts by local governments to raise revenues to make up for budget shortfalls. This also explains the 5.8 percent rate of increase in tobacco prices over the last quarter.
Most other areas of the index show flat or falling prices. Apparel prices fell by 0.4 percent in October and have fallen at a 1.2 percent annual rate over the quarter. The recreation index fell by 0.4 percent in October and has declined at a 1.4 percent rate over the quarter. The communication index was flat in both October and for the quarter.
There is a mixed picture at earlier stages of production. The overall finished goods index rose 0.3 percent, driven by 1.6 percent rises in both food and energy prices. The core index is reported as falling at 0.6 percent, with core consumer goods falling at a 0.5 percent rate. This decline is difficult to reconcile with the reported inflation in components. No component showed a decline of more than 0.5 percent, while several small components showed substantial price increases. Over the last quarter, the overall index has increased by 6.0 percent, while the core index has fallen at a 1.8 percent rate. The overall intermediate good index has risen at a 9.7 percent annual rate, while the core index has increased at a 5.5 percent rate.
Insofar as there is inflation, it is coming either from the withdrawal of government subsidies (e.g. education) or higher fees and taxes (e.g. tobacco). Higher import prices associated with a falling dollar will also be a source of modest inflation in the months ahead.
Dean Baker is Co-Director of the Center for Economic and Policy Research in Washington, DC. CEPR’s Prices Byte is published each month upon release of the Bureau of Labor Statistics’ reports on the consumer price and the producer price indexes. For more information or to subscribe by email, contact CEPR at 202-293-5380 ext. 102 or email [email protected].


