July 01, 2015
Ten years ago, with the technology-stock bubble well past us, the Congressional Budget Office (CBO) predicted that from 2000–2015 the potential for the United States economy to produce goods and services—at full employment—would grow 58 percent. This year, CBO estimates that same growth at only 38.5 percent. In effect, more than 12 percent of the estimated productive capacity of the economy has been lost in the last five years of revisions.
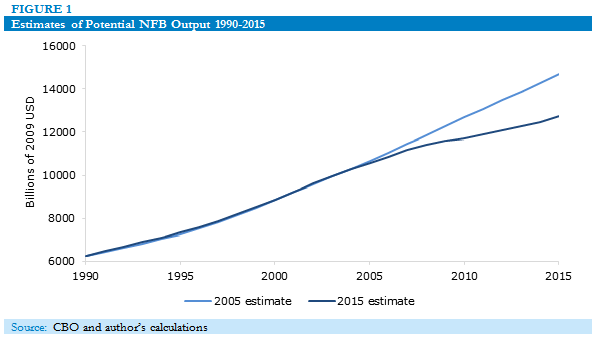
What does CBO think has changed in the last five years that makes them so pessimistic? Let us take a look at their numbers for nonfarm business (NFB)—which covers about three-quarters of the economy. CBO now estimates 2.45 percent annual full-employment growth in this sector between 2000 and 2015; they had estimated 3.43 percent back in 2005, resulting in a 13.3 percent cumulative downward revision to potential output by 2015.
Figure 1 shows CBO’s 2015 estimate of potential NFB output in billions of 2009 dollars, along with their 2005 estimate scaled to match the current estimate for output in 2000 (about $8.85 trillion.)

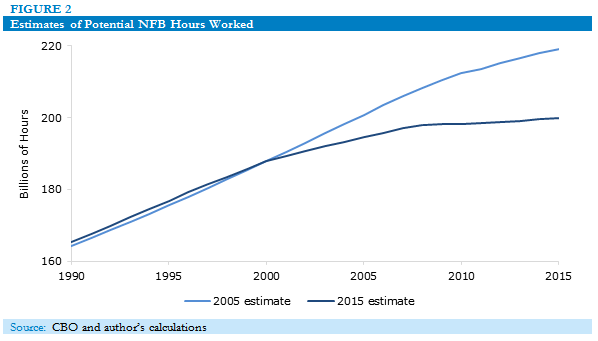
Breaking the numbers down further, almost half the decline has come from slower growth in potential NFB labor hours—that is, from lower labor force participation and shorter workweeks. In 2005, CBO estimated that aggregate full-employment hours available in NFB would grow 1.0 percent per year but now only anticipates 0.42 percent growth between 2000 and 2015. CBO today puts potential hours 8.7 percent below its estimate ten years ago; they estimate this has reduced annual growth in potential NFB output by about 0.43 percentage points.
As seen in Figure 2, the relatively slow growth in potential hours began well before the current recession. Prime-age workers have increasingly left the labor force, and it appears that CBO believes they are not likely to return.

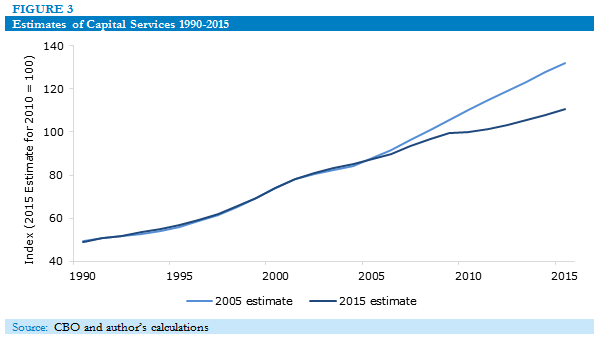
The collapse of the housing bubble followed by an extended period of time below full employment has meant little incentive to invest. Hence, as seen in Figure 3, the capital stock has grown more slowly than anticipated a decade ago. CBO estimates this low investment has lowered the annual rate of growth in potential NFB output by 0.37 percentage points.

Finally, total factor productivity—that is, everything else entering into potential NFB output has grown a little more slowly than anticipated (1.33, compared to 1.50 percent per year) lowering annual growth in NFB output by about 0.17 percentage points.
Possibly, when the capital stock has depreciated sufficiently, investment may return on its own—increasing capital and increasing labor force participation as the market tightens. This is Keynes’ much-disfavored hands-off solution to extended periods of depression. However, if we encourage businesses to move production to other countries (say, by protecting foreign investments with favorable dispute resolution) then CBO may never revise upward potential output. This may propagate unnecessarily low expectations for economic growth and leadpolicymakers into making poor decisions.
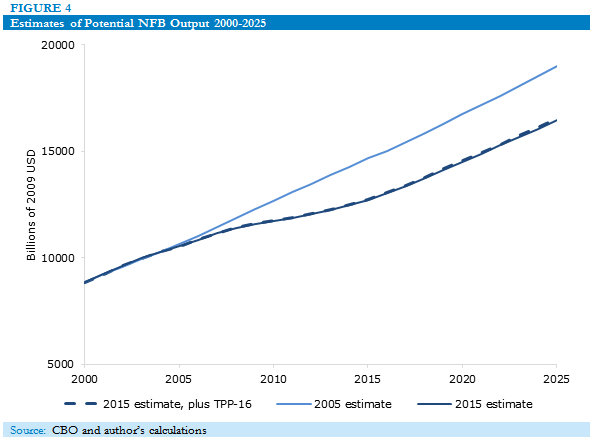
As it stands, CBO currently estimates potential NFB output in 2015 to be 13.3 percent below where it would have been had growth been as expected a decade prior. Certainly, a large part of this gap may be attributed to failure to maintain full employment. By contrast, the Peterson Institute estimated that a large-scale Trans-Pacific Partnership (TPP) could increase GDP by as much as 0.38 percent by 2025 (Figure 4).

This means we would need 38 trade agreements of similar size to make up the difference. Of course, this would be not merely difficult but impossible to manage. Even if we accept these estimated gains from tariff reductions resulting from the TPP, such gains must diminish rapidly with successive agreements.
In the end, we are left with a decade of bad news out of CBO.


