February 06, 2019
February 6, 2019, Eileen Appelbaum
Presentation to the Congressional Progressive Caucus by Eileen Appelbaum, Co-Director, Center for Economic and Policy Research
February 6, 2019
Introduction
In recent weeks and in quick succession Alexandria Ocasio-Cortez promoted a top marginal tax rate of 70 percent on the part of incomes of the super-rich over $10 million, Elizabeth Warren proposed a wealth tax on ultra-millionaires and billionaires, and Bernie Sanders revealed his “For the 99.8%” proposal that would expand the estate tax on the wealthiest 0.2 percent of families. These proposals are not schemes to soak the rich, nor are they primarily about collecting revenue. Rather, they provide the basis for meaningful tax reform whose twin goals are reducing extreme income and wealth inequality and protecting American democracy from the predations of wealthy plutocrats.
In the 34 years between 1946 and 1980, New Deal policies that included progressive income and estate taxation as well as financial reforms that regulated the accumulation of wealth led to rising wages for ordinary workers, a decline in income inequality, and a more equal distribution of wealth. In the years since 1980, tax cuts for the wealthy, the near extinction of the estate tax, and the rollback of financial regulations have led to a boom in incomes and an explosion of wealth for America’s ultra-rich families. Together with the Supreme Court’s 2010 Citizens United decision that allowed large political contributions, big corporations and rich individuals have used their wealth to protect their interests and to engage in philanthropy that indulges their impulses and imposes their preferences on society without any accountability to the public.
The recent tax proposals seek to redress this situation by reducing income and wealth inequality, preventing the emergence of an aristocracy of inherited wealth, and defending American democracy against an army of lobbyists and lawyers paid to undermine it. Representative Ocasio-Cortez’s proposed 70 percent marginal tax rate on annual income above $10 million will begin to reverse this.
Marginal Tax Rates and High Marginal Taxes on Annual Incomes over $10,000,000
What Are Marginal Tax Rates?
There is much confusion over marginal tax rates. Many people think that a married couple with joint income of, say, $77,500 and in the 22 percent tax bracket, pays 22 percent of their total income in federal income taxes. But that is incorrect. Here is a simple example to help you understand how marginal tax rates or tax brackets actually work.
Table 1 shows actual tax brackets for a married couple filing taxes jointly on their 2018 income.[1] To keep things simple, let’s suppose that they had a joint income of $19,150. Here is how marginal tax rates work. The marginal tax rate on incomes of $1 to $19,050 is 10 percent, so this married couple pays only 10 percent of the first $19,050 of their income. That comes to $1,905 in taxes. However, they have a joint income of $19,150 which puts them $100 over the cut-off for the 10 percent rate and puts them in the 12 percent tax bracket. But they do not pay 12 percent of their total income in taxes. Because 12 percent is a marginal tax rate, they pay 12 percent only on the additional $100, or an extra $12. Their total income tax rises from $1,905 to $1,917.
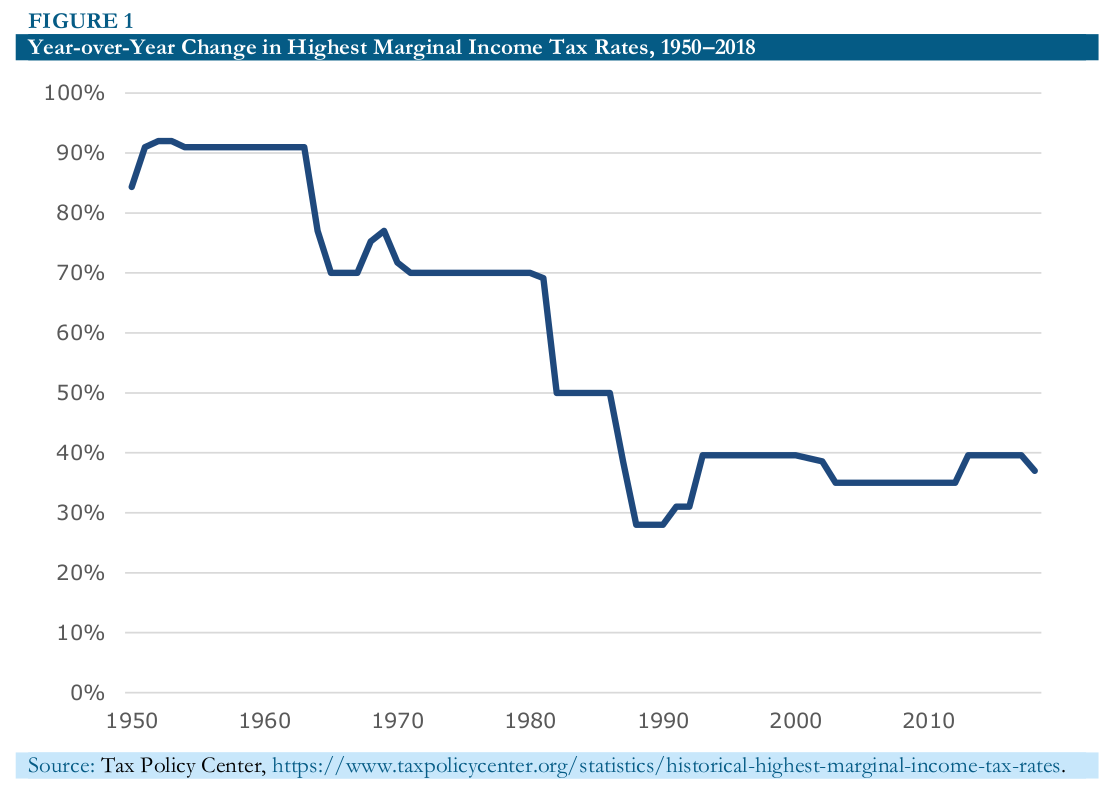
Figure 1 depicts the highest marginal tax rate on top labor income in every year from 1950 to 2018. This tax is paid only on the part of the income that falls in the top tax bracket. Three things stand out:
-
Marginal tax rates on top incomes have varied widely;
-
Top tax rates were as high as 70 percent in the late 1960s and 1970s; and
-
Top tax rates even exceeded 70 percent in some periods.
The historical record suggests that a 70 percent top marginal tax rate is neither unheard of nor very radical.
Table 1 – Joint Filers Tax Rates
|
Bracket |
Tax is this amount plus this percentage |
Of the amount over |
|
$0 to $19,050 |
$0 plus 10% |
$0 |
|
$19,050 to $77,400 |
$1,905 plus 12% |
$19,050 |
|
$77,400 to $165,000 |
$8,907 plus 22% |
$77,400 |
|
$165,000 to $315,000 |
$28,179 plus 24% |
$165,000 |
|
$315,000 to $400,000 |
$64,179 plus 32% |
$315,000 |
|
$400,000 to $600,000 |
$91,379 plus 35% |
$400,000 |
|
Above $600,000 |
$161,379 plus 37% |
$600,000 |
Source: Internal Revenue Service.

What Is the Optimal Tax Rate on Top Labor Incomes? [2]
Top marginal tax rates in the United States have been applied only to exceptionally high incomes. They applied only to the super-rich, and not to the merely rich like doctors, professors, system analysts, managers of small- and medium-sized businesses or others who draw incomes in the hundreds of thousands of dollars. This is also true of the proposal from Representative Ocasio-Cortez. It would tax only the part of an individual’s annual income that is over $10 million at a 70 percent rate.
There are three things economists think about when setting the top marginal rate on super-high earnings.
First, there is the possibility that an increase in the tax rate will reduce the actual economic activity of high-income earners. Piketty, Saez, and Stantcheva (2011) point out that studies have not “been able to show convincing evidence in the short- or medium-run of large actual real economic activity responses of upper earners to tax rates.” There is not much concern that a tax rate of 70 percent on the part of an ultra-high earner’s income over $10 million will lead them to reduce effort. (Manny Machado may be the exception. As a Phillies fan, I’m concerned about his attitude, but I don’t think whether he hustles at third base or not will affect the economy.)
Second, high-income individuals can hire high-priced tax lawyers and accountants to help them dodge income taxes. Reported upper-income earners respond to tax rates, whenever loopholes in the tax code let them avoid paying their fair share of taxes, by changing the form of compensation (e.g., recharacterizing compensation from ordinary income as capital gains income taxed at a lower rate, reducing cash compensation in exchange for access to the company jet, disguising vacation travel as business travel) or by actual tax evasion (e.g., shifting income to offshore accounts in tax havens). Tax avoidance behavior responds to the design of the tax code, and this is something Congress can control. The current US tax code has many loopholes and offers countless opportunities for avoidance.[3] But the tax system can be changed, and the possibilities for avoiding taxes reduced. In particular, broadening the tax base to include all forms of income, applying the same tax rate across forms of income, ensuring that taxes on corporate profits are the same for profits booked in the United States and those held offshore, and increasing tax enforcement can greatly reduce tax avoidance.
If Congress does not close the loopholes in the tax code to rule out opportunities for those with extraordinarily high incomes to engage in tax avoidance, there is little point in enacting a 70 percent marginal tax rate.
The third consideration is the effect of the top tax rate on the effort the highest earners put into bargaining for higher pay. Bargaining efforts are not productive and do not increase the size of the economic pie. Indeed, they are wasteful and since they don’t lead to an expansion of GDP, they are zero-sum in the sense that higher compensation for the top earners leaves less for other workers. High marginal top tax rates reduce the incentive that those earning, say, $10 million, have to expend the effort to bargain for an additional million in pay. At today’s 37 percent top marginal tax rate, another million dollars in pay will increase after-tax income by $630 thousand. At a top marginal tax rate of 70 percent, after-tax income will increase by $300,000 — less than half that amount. If, as a result, high earning individuals forego the additional million dollars in compensation, businesses will have that money available for other purposes, including raising wages.
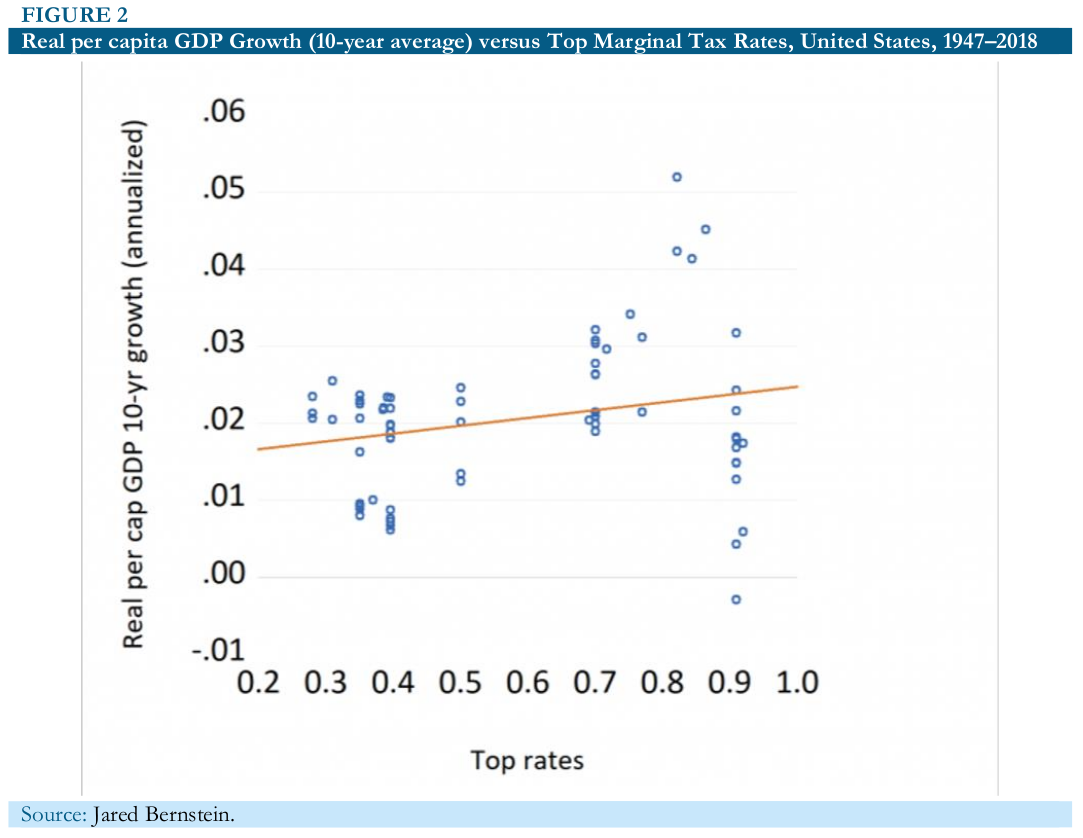
The main argument against a high marginal tax rate on the incomes of ultra-rich individuals is that such tax rates sap the work effort and entrepreneurial activity of these super-high earners. This, the argument goes, slows economic growth and, in the end, hurts both workers and the economy. Lower top marginal tax rates, it is argued, spur greater work effort and enterprise and increase economic growth. But, as Jared Bernstein shows in Figure 2, there does not appear to be a systematic relationship between top marginal tax rates and the growth rate of per capita GDP.

On the other hand, large cuts in top marginal tax rates in the 1980s led to a surge in pre-tax incomes of ultra-high earners. This is consistent with the argument that the lower tax rate increased the efforts top earners put into bargaining for still higher pay for themselves, and resulted in their receiving more pay. If the cut in the top tax rate did not also result in an increase in GDP, then this increase in top incomes came at the expense of individuals further down the income scale.
The divergence of productivity growth and wages of production and non-supervisory employees beginning around 1980 is well-known. The decline in unionization rates over the last 35 years has reduced the effectiveness of unions in capturing a fair share of productivity gains for frontline workers. As a result, powerful corporate executives and elite professionals have been able to capture a larger and larger share of the economic pie.
So, where have the productivity gains that have not been shared with frontline workers gone? They have been captured by those at the top of the income distribution. Economic output — that is, GDP per person — has almost doubled since 1980, but workers’ incomes have not kept pace. If they had, the average middle class household would have $15,000 a year more.[4] A 70 percent top tax rate can act as a restraint on the compensation of super-high-paid executives and others through its effect on the effort these individuals put into bargaining for pay above $10 million. The net return to such bargaining will be much more modest with a 70 percent top marginal tax rate than under the current top rate of 37 percent.
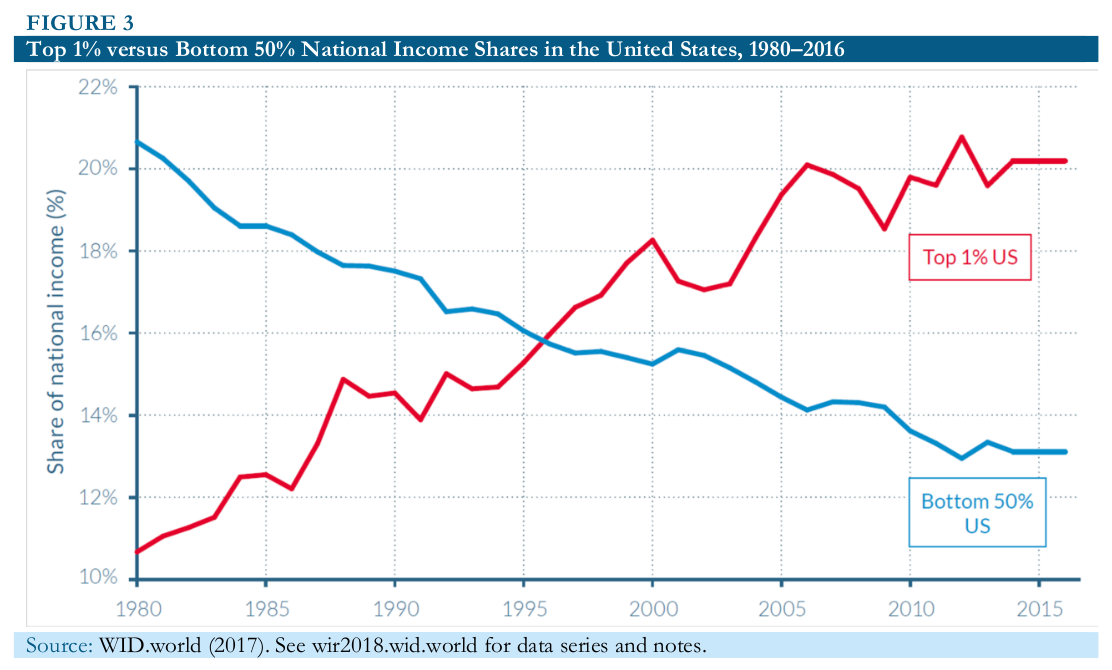
Looking at shares of total (labor and capital) income[5] reveals that by 2014, the 117 million adults that make up the bottom 50 percent of the working-age population had an average annual real income of $16,600 — a minuscule increase of just $200 since 1980. Taken together, their income amounted to a 13 percent share of national income. The share of national income going to the top 1 percent — 2.3 million adults earning an average of $1.3 million a year — was more than 20 percent, and higher than the share of the bottom 50 percent (Figure 3).
Progressive taxes and transfers are effective in reducing income inequality. The mildly progressive policies in effect in 2014 did reduce income inequality somewhat (although the 2017 Tax Cuts and Jobs Act, as well as executive branch efforts to reduce access to benefits, has likely reduced this effect). Average income after taxes and transfers of the bottom 50 percent rose to $25,500 in 2014.

Income Inequality Increases Wealth Inequality
The increase in income inequality has been a major contributor to the rise in wealth inequality over the past 40 years.[6] First, rising income inequality increases the wage share of top income earning families, and decreases the wage share of the bottom 90 percent. Second, the savings rate out of the income of wealthy families is high; over the period 1917 to 2012, the top 1 percent saved 20 to 25 percent of their income while the next 9 percent of families saved 15 percent. The savings rate for the bottom 90 percent varied over this period from +5 percent to -5 percent. On average, these families saved 3 percent of their income. But in recent years, rising household debt — mortgage debt, credit card debt, and student loan debt — has reduced the savings rate of these families to close to zero. Third, the rise in debt may itself be fueled by the increase in income inequality. Stagnant wages and rising housing costs have led to higher mortgage debt, while non-mortgage debt has increased as families borrow to make ends meet or pursue more schooling to achieve higher incomes.[7]
Thus the rapid increase in wealth of the richest families results in large measure from rising income inequality. The rise in top incomes means that wealthy families consume less of their incomes and save much more than families lower on the income scale. These savings are used to acquire assets and increase their wealth. Saez and Zucman argue that this has had a “snowballing effect” that allows more wealth accumulation at the top.[8]
Conclusion
It is past time to reverse 40 years of tax breaks for the highest earners that have contributed to the upward redistribution of income. The proposal put forward by Representative Ocasio-Cortez will go a long way toward achieving this goal.
[1] See https://www.fool.com/taxes/2018/01/05/what-are-the-new-and-improved-2018-tax-brackets.aspx for details on tax brackets for other types of filers.
[2] This section draws on the analysis in “Optimal Taxation of Top Labor Incomes: A Tale of Three Elasticities” by Thomas Piketty, Emmanuel Saez and Stefanie Stantcheva, Centre for Economic Policy Research, November 2011. www.cepr.org/pubs/dps/DP8675.asp.
[3] Jared Kushner’s 2015 tax return, obtained by The New York Times, suggests that it may be more difficult to close loopholes in income tax rules than some observers think. “How Jared Kushner Avoided Paying Taxes,” by Jesse Drucker and Emily Flitter, The New York Times, October 13, 2018. https://www.nytimes.com/2018/10/13/business/kushner-paying-taxes.html.
[4] “What’s Really Radical? Not Taxing the Rich” by David Leonhardt, The New York Times, February 3, 2019. https://www.nytimes.com/2019/02/03/opinion/democrats-wealth-tax.html.
[5] “Distributional National Accounts: Methods and Estimates for the United States,” by Thomas Piketty, Emmanuel Saez, and Gabriel Zucman, Quarterly Journal of Economics, 2018, pp. and World Inequality Report 2018, World Inequality Lab, pp. 80–82. www.wid.world/team.
[6] Information on wealth inequality in this section is drawn from: “Wealth Inequality in the United States Since 1913: Evidence from Capitalized Income Tax Data,” by Emmanuel Saez and Gabriel Zucman, 2016, Quarterly Journal of Economics, 131(2), 519–578; and World Inequality Report 2018, World Inequality Lab. www.wid.world/team.
[7] World Inequality Report 2018, pp. 217–18.
[8] World Inequality Report 2018, p. 214.


