October 30, 2016
By Lara Merling
The official unemployment rate in the U.S. is currently estimated at 5 percent, a number that is sufficiently low for some to claim that the economy is at full employment. The unemployment rate varies significantly across states. Between September 2015 and March 2016 the unemployment rate has averaged 2.8 percent in North Dakota, 3 percent in Hawaii and New Hampshire, while in West Virginia it was at 6.4 percent, and in Washington DC, and Alaska it averaged 6.6 percent.
Once the labor market is at full employment, it is difficult to have much by way of further employment gains beyond the growth in the working-age population. If the current 5.0 percent unemployment rate is actually close to full employment, then we should expect to see smaller increases in the employment-to-population ratio (EPOP) in states with lower unemployment rates, since these states should be running up against the full employment limit. We would then expect higher gains in EPOPs in states that have higher unemployment rates which are further away from reaching full employment.
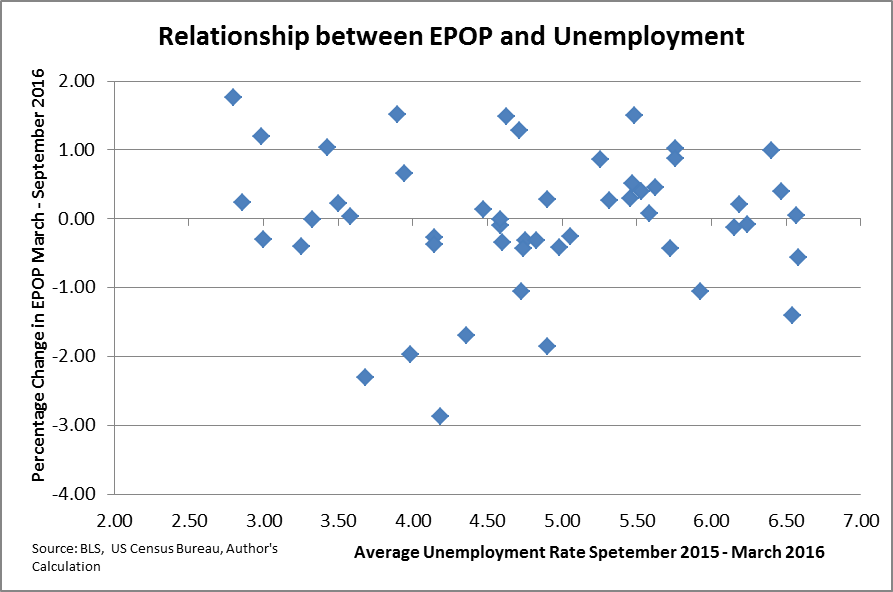
The figure below compares the change in the EPOP in each state over the period from March 2016 and September 2016, for people between the ages of 18 and 64, with the state’s average unemployment rate for September 2015 to March 2016.

As can be seen there is no relationship between the unemployment level and the change in EPOP. Some states with very low unemployment rates have seen large increases in EPOP, while some of the states with the highest unemployment levels have seen much smaller increases, or even decreases in EPOP. While this comparison is far from conclusive, it does not easily fit with a story with the labor market approaching full employment.


Comments