June 04, 2016
The May jobs report was worse than most analysts (including me) had expected. We are now seeing a lot of columns asking how bad was it? My answer is pretty bad.
First, to get an obvious source of overstated weakness out of the way, we lost 35,000 jobs in the communications sector due to the Verizon strike. Those jobs will come back in the June report. If we add that number in we get 73,000. That’s better, but hardly a great report.
Furthermore, this bad report wasn’t hugely out of the line with the reports from the prior two months, both of which were revised down with the May release. The average for these two months was 154,500. Taken together, the three reports provide solid evidence that the rate of job growth has slowed sharply from the 200,000 plus rate of the prior two years.
We get a similar story if we look at total hours. Since December, the index of average weekly hours has risen at less than a 0.7 percent annual rate. This compares to a 2.0 percent rate over the prior year. (The index has actually been slightly negative if we use January, 2016 as the start point.)
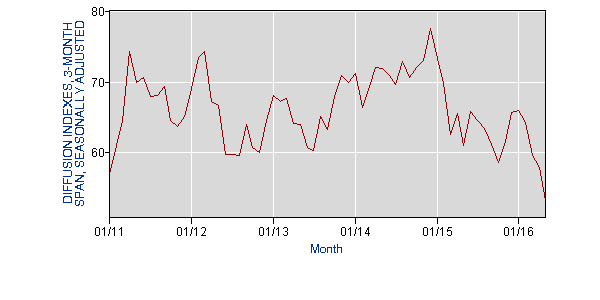
We can also look to other items in the report that are to some extent independent of the establishment jobs numbers. For example, we can look to the employment diffusion indexes, which show the percentage of industries in which employers expect to add workers over a given period. All of these have fallen sharply in recent months.
The 3-month index, which asks employers whether they expect to add or reduce employment in the three months centered on May (i.e. April, May, and June) fell to just 53.2 in May. This index had averaged well over 60 in the years 2013–2015. It also has not had a comparable dip in other months of weak job growth. For example, in December of 2013, when the establishment survey showed a gain of 45,000 jobs, the 3-month diffusion index was at 70. In March of 2015 when the establishment survey showed 84,000 new jobs, the 3-month diffusion index was at 62.6. The sharp decline in the diffusion indexes (the decline is comparable in all of them), can be taken as solid evidence of slower job growth.
Diffusion Index, 3-Month Span
Source: Bureau of Labor Statistics.
Finally, we can look at the household survey, which is a completely separate survey of employment that is released at the same time as the establishment survey. The monthly data from this survey are highly erratic, but there is no reason that a random error in the household survey would go in the same direction as a random error in the establishment survey. The household survey showed a gain in employment of 26,000 in May, after showing a loss of 316,000 in April. By comparison, in December of 2013 it showed a gain in employment of 129,000 and in March of 2015 an increase of 102,000. Neither month stood out as being weak in these reports.
Some have pointed to the modest pick-up in wage growth as evidence of labor market tightening. Over the last year the average hourly wage has risen by just under 2.5 percent. If we compare the average of the last three months (March, April, May) with the average of the prior three months (December, January, February) the annual rate of increase has been a bit more at 2.9 percent. However, it is important to remember that this is measuring the wage component of compensation. Employers have been reducing the generosity of health care benefits, so part of the explanation of more rapid wage growth is not increased bargaining power driving up labor compensation, but a shift from non-wage compensation to wage compensation.
The employment cost index controls for this effect. It actually shows a slight slowing in the rate of compensation growth over the last year. Over the twelve months ending in March of 2016 (the most recent data available) employment costs have increased at just a 1.9 percent annual rate. That is down from a 2.6 percent rate in the twelve months ending in March of 2015.
If we look at the larger economic picture we get a similar story of an economy that is growing at a very modest pace. GDP growth in the first quarter was just 0.8 percent. While this was depressed by some anomalous factors, growth in the fourth quarter of 2015 was not much better at 1.4 percent. We are likely to see somewhat better growth in the second quarter, but it is unlikely that growth for the year will exceed 2.0 percent.
The sources of weakness are not hard to find. Investment in equipment has been falling for the last two quarters, driven by the oil bust and rising trade deficit. Investment in non-residential structures has also been dropping, due to some serious overbuilding in many sectors earlier in the recovery. Consumption spending is growing at a modest pace, and will continue to, but it is not going to outpace wage and income growth. Government spending is of course contained by the austerity crew who see virtue in strangling the economy.
The bottom line is that the May report may be somewhat worse than the underlying trends for employment (after adding in the 35,000 striking Verizon workers), but it is probably not an anomaly. We have good reason to believe that the economy has downshifted to a path of slower employment growth. At least for working people, this is not good news.


Comments