November 16, 2015
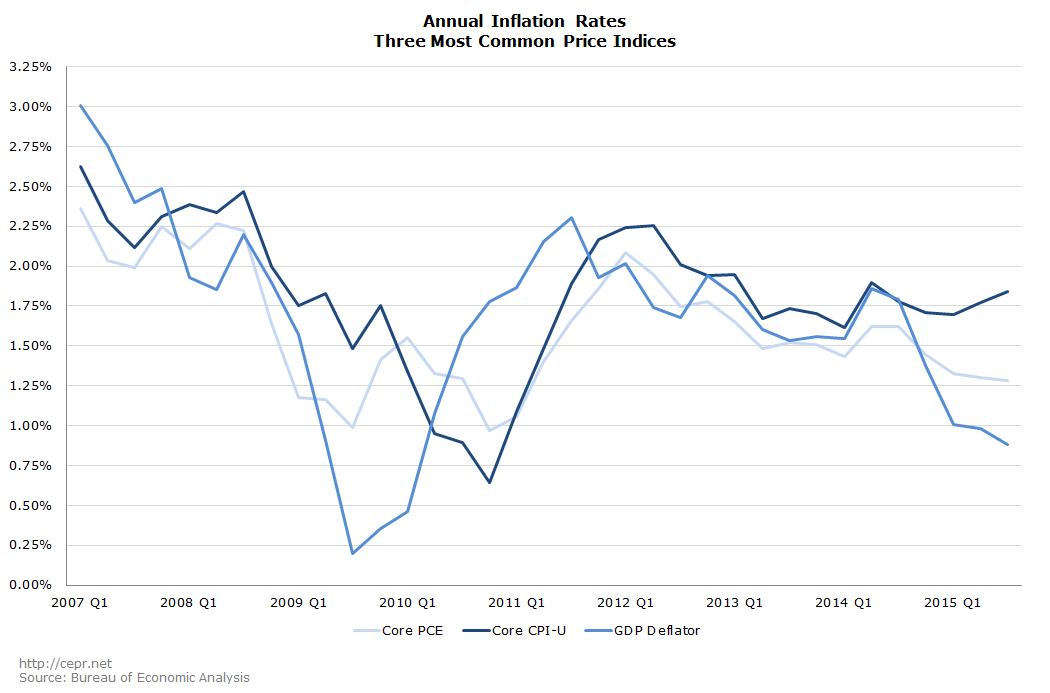
During the 2007–2009 recession, inflation fell significantly. After a brief uptick in prices in late 2011 and early 2012, inflation again subsided. According to all three of the major price indices, inflation remains below the Federal Reserve’s target inflation rate of 2.0 percent, as shown in the figure below[i]:

However, it should be noted that the Fed’s target inflation rate of 2.0 percent is based on the Core Personal Consumption Expenditures (Core PCE) index. (“Core” indices exclude food and energy prices, which are somewhat volatile and don’t serve as good predictors of future inflation.) This is an important detail, because the core PCE index will almost always show a lower rate of inflation than the core CPI-U. Some news outlets such as Bloomberg and InflationData.com have missed this point and reported on the Fed’s target as if it applied to the core CPI-U. This error gives the appearance that inflation is running much closer to target than it actually is.
While the core CPI-U has shown an inflation rate of 1.7 percent over the last year, inflation as measured by the core PCE has been just 1.3 percent. Using the core CPI-U, the inflation rate appears just 0.3 percentage points below target. However, the core PCE is actually 0.7 percentage points below the Fed’s target. This indicates that inflation has a long way to go just to reach the Fed’s target.
It is also important to remember that the 2.0 percent inflation target is officially an average, not a ceiling. This means that the inflation rate can be over 2.0 percent for some time and still be consistent with the Fed’s stated target.
The exact data for the most recent quarterly inflation figures — those from the third quarter of 2015 — are given in the table below. Inflation is below target according to all three indices. This adds strength to the argument that the Federal Reserve shouldn’t raise interest rates next month. The primary impetus for raising rates is to moderate inflation and keep it from rising significantly above the Fed’s target rate. But inflation is already well below target no matter how we choose to measure it.
| Inflation Rates, Third Quarter of 2015 | |||||
| Target Inflation Rate | Inflation Rate, 2014 Q3 to 2015 Q3 | Percentage Points Above (+) or Below (-) Target | Annualized Inflation Rate, 2015 Q2 to 2015 Q3 | Percentage Points Above (+) or Below (-) Target | |
| Core Personal Consumption Expenditures Index | 2.0% | 1.3% | -0.7 | 1.3% | -0.7 |
| Core Consumer Price Index | 2.3% | 1.7% | -0.6 | 1.8% | -0.5 |
| Gross Domestic Product Deflator | 2.1% | 1.2% | -0.9 | 0.9% | -1.2 |
| Source and notes: The estimates for the target inflation rates for the Core CPI-U and the GDP Deflator come from page 86 of the CBO’s August 2015 Update to the Budget and Economic Outlook. | |||||
[i] The figure shows the percent change in prices from one year ago.


