July 30, 2013
July 30, 2013 (Housing Market Monitor)
By Dean Baker
Prices for homes in the bottom tier in San Francisco have risen at a 61.0 percent annual rate over the last three months.
The Case-Shiller 20-City Index rose by 1.0 percent in May, with 18 of the 20 cities showing gains. Prices are now up by 12.2 percent from their year-ago levels and have risen at a 20.6 percent annual rate in the last three months.
The California cities again had the largest gains. San Diego led the way with a 2.6 percent rise in prices followed by San Francisco with a 2.0 percent increase. Other cities with large gains were Las Vegas at 2.4 percent, Detroit at 1.8 percent, Miami at 1.7 percent, and Chicago at 1.5 percent. Los Angeles and Seattle both had increases of 1.4 percent in May. The price declines were in Cleveland (0.5 percent) and Minneapolis (0.2 percent).
The drop in Minneapolis was most likely a fluke. The city had been showing rapid price increases, with the May level up by 14.1 percent from the year-ago level. In comparison, Cleveland’s prices have been close to flat, rising by 3.4 percent over the last year. The May increase in Detroit is part of general upward trend in the city. Prices are up by 19.1 percent from their year-ago level and 31.0 percent from the low point hit in April of 2011.
The price increases continue to be driven largely by the bottom third of the housing market in the cities with the most rapid run-ups. This was the segment of the market that was hardest hit in the downturn and is now recovering very rapidly.
In Tampa, prices for homes in the bottom tier rose by 2.4 percent in May. They have risen at a 34.0 percent annual rate over the last three months and have risen by 17.6 percent over the last year. In San Diego, prices for homes in the bottom tier rose by 2.7 percent in May. They have risen at a 37.0 percent rate over the last three months and are up 23.0 percent over the last year. The numbers for San Francisco are 3.6 percent for May, a 61.0 percent annual rate over the last three months, and a 33.5 percent increase over the last year. For Los Angeles, the increases in the bottom tier were 2.5 percent in May, 46.3 annual rate over the last three months and a 26.7 percent rise over the last year.
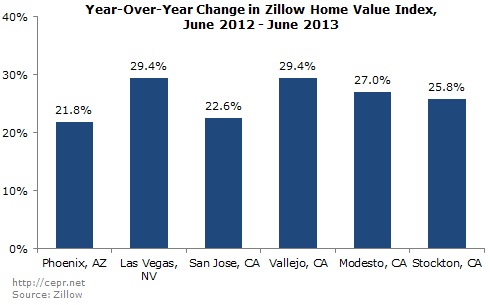
The price indices constructed by Zillow show even more rapid increases in many of the cities that had been hardest by the collapse of the housing bubble. In the Zillow index, the year-over year increase in prices in Las Vegas was 29.4 percent, a rate matched by Vallejo, CA. Modesto, CA, had a 27.0 percent year-over-year increase in prices. In Stockton, CA, the rise was 25.8 percent.
The extraordinary run-ups in these markets is serious cause for concern. As noted before, prices were badly depressed in the downturn, so there was room for a substantial rebound. However in many these markets are prices are already above trend levels. Much of the increase in these markets is being driven by investors, many of whom hope to flip houses for a profit in a relatively short period of time. This is exactly the sort of irrational exuberance that we saw in the bubble years, albeit without the wacky loans of that period.
Whether or not these markets face serious bubbles will depend on whether the extraordinary rate of price increases continue. If prices are more or less in line with fundamentals now, but are rising at a 30 percent annual rate, they will be overpriced by 30 percent in a year. That raises the risk that many homebuyers will seriously overpay and face large losses when the market returns to more normal levels.
It is important to remember that these data are seriously dated. The May data show prices on sales that were closed in March, April and May. They were likely contracted between January and March. It is possible that price rises have since slowed, especially with the rise in mortgage interest rates. However, if that is not the case, it is likely that prices in many of the hottest markets are already substantially over-valued.


