March 14, 2013
In his most recent column, Thomas Edsall says there are three ways of defining poverty in the United States: the official measure, the Census Bureau’s Supplemental Poverty Measure, and a consumption-based measure. But this leaves out an important and commonly used set of poverty measures, ones that Edsall himself has cited in previous columns: so-called relative poverty measures, which set the poverty line at a percentage of median income, typically 50 or 60 percent of median, that reflects a very basic standard of living. (I’m not a big fan of the term “relative”—it’s hard to imagine a meaningful poverty measure in a wealthy nation that isn’t relative in some way to real-world living standards—but it’s the prevailing term among researchers, so I’ll use it here.)
The idea behind relative measures is simple and goes back to Adam Smith’s definition of “necessaries” to include “not only the commodities which are indispensably necessary for the support of life, but what ever the customs of the country renders it indecent for creditable people … to be without.” As I’ve explained previously, one of the strengths of relative poverty measures is that they do a better job, compared with poverty measures only adjusted for inflation, of capturing the change over time in broad public consensus—Smith’s “customs of the country”—on the minimum amount of income that an American family needs to “get along” in their local community.
A second strength, one particularly relevant to Edsall’s column, is that relative poverty rates are calculated using nominal dollars, allowing us to assess poverty in a way that brackets questions about how to properly measure inflation (for more on those questions, see my colleague Dean Baker’s post on Edsall’s piece as well as this earlier post of mine).
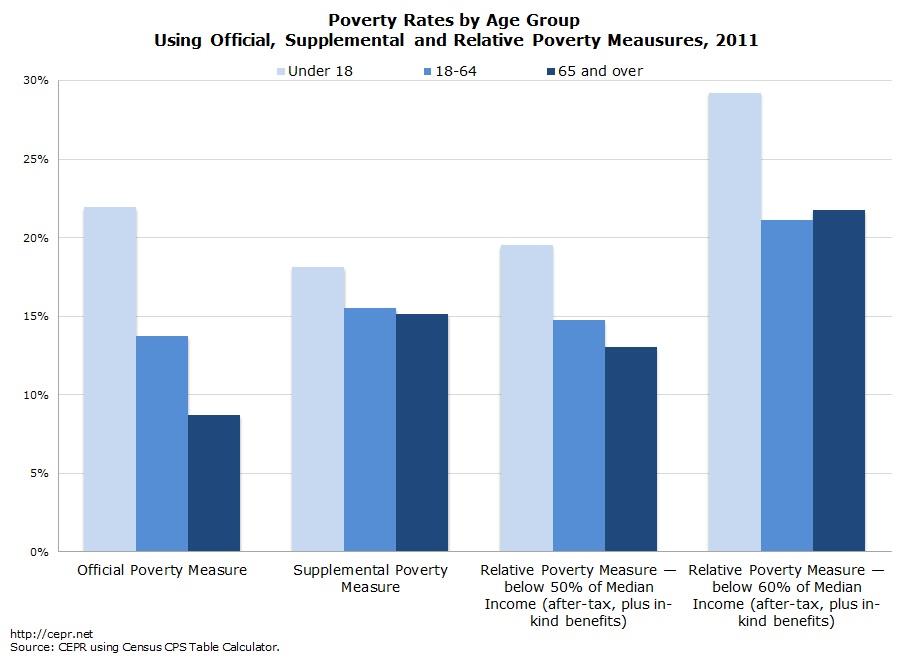
The chart below compares the official and Supplemental Poverty Measures with two relative poverty measures, one set at 50 percent of median income, the other set at 60 percent of median income. The relative thresholds are calculated using a fairly comprehensive measure of income, one that subtracts taxes and includes most benefits, including in-kind ones. For a family of four, the official poverty threshold is $22,811, the supplemental threshold is $25,222, the 50% of median threshold is $25,974, and the 60% of median threshold is $31,168. All of these amounts fall far below the amount that Americans say is the minimum amount of income a family of four needs to “get along in your local community.” In fact, in 2007, the median response to this question in a Gallup poll was $45,000.
Click for a larger version
Source: CEPR using Census CPS Table Calculator.
The main thing to note in the chart is that the poverty rate for the elderly (the darkest-blue bars) is considerably higher when using the Supplemental Poverty Measure or either of the relative measures than it is when using the official poverty measure, and that the gap between children’s (the lightest-blue bars) and senior’s poverty rates is narrower when using these measures than the official measure. Similarly, the senior’s poverty rates converge toward the poverty rates for working-age adults when using either the Supplemental measure or the relative rates. The bottom line: A substantial share of seniors, probably between 15 to 20 percent, live on incomes that place them below or very close to the edge, a reality that the official poverty line understates.
Edsall’s column is mostly framed around the question of whether the poverty rate for the elderly is relatively low (as the official measure suggests) or similar to that of other groups (as both the Supplement and the relative measures suggest). But it’s also worth asking this question about the child poverty rate. Is the real child poverty rate substantially lower than the official poverty rate (as the Supplemental Poverty Measure suggests) or substantially higher (as the threshold set at 60 percent of median income suggests)?
In a previous post, I discussed why I think the Supplemental measure underestimates child poverty. I won’t rehash that post, but will highlight what I see as the major limitation with the SPM as applied to children:
“… the [Supplemental Poverty Measure] largely fails to take children’s basic needs for care and healthy development into account. These needs are not built into the [SPM’s] poverty threshold, and they are largely not captured by subtracting out-of-pocket spending by parents on work-related child care and medical care. For the elderly, who nearly all have health insurance, subtracting out-of-pocket medical spending does a better job of capturing their care needs.
This major flaw in the [SPM’s] approach to measuring child poverty is particularly important in light of recent research on growing inequality in parental spending on children’s development. … Whither Opportunity? Rising Inequality, Schools and Children’s Life Changes, an important new volume from the new Russell Sage Foundation, shows how spending on child-enrichment goods and services jumped for families in in the top income quintile, while remaining largely unchanged for families in the bottom income quintile.”
Barbara Bergmann and others make a similar point when they note that: “the most dramatic development of the last half-century has been the flow of women into the formal labor force, with the resulting partial marketization of child care (in the case of the United States. It’s vexing, then, that the first major reform of poverty measurement in the last half century [the SPM] doesn’t satisfactorily represent the implications of that development.”
Given this, it seems reasonable to assume that a poverty measure that took children’s basic needs for care and healthy development into account would have a threshold at or higher than the 60%-of-median measure ($31,200 for a family of four) and considerably higher than either the official poverty line ($22,800) or the SPM ($25,200).


