November 01, 2012
November 1, 2012 (Housing Market Monitor)
By Dean Baker
The number of new homes sold in September was up 27.1 percent from its year-ago level although it is still only a bit more than half of the pre-bubble level.
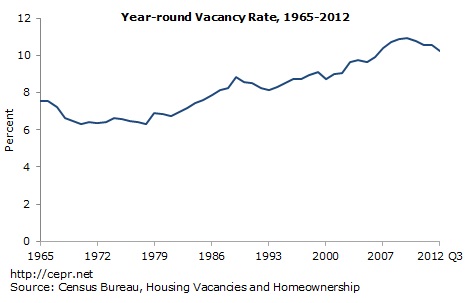
The Census Bureau reported that the vacancy rate continued to edge lower in the third quarter; although, most measures are still well above pre-bubble levels. The overall year-round vacancy rate fell to 10.2 percent in the third quarter. This is down from 10.8 percent in the third quarter of 2011 and a peak of more than 11.0 percent in the trough of the recession.

The vacancy rate for ownership units fell to 1.9 percent compared with 2.4 percent in the third quarter of 2011 and a peak of 2.9 percent in 2008. The rental vacancy rate fell to 8.6 percent, down from 9.8 percent in the third quarter of last year and a peak of 11.1 percent in 2009.
While the ownership vacancy rate is approaching pre-bubble levels, it is best to focus on broader measures of vacancies. Units frequently switch back and forth between ownership and rental status. (Roughly 30 percent of rental units are single-family homes.) It is worth noting that the number of vacant units that are listed as being held off the market (5.4 percent of all units) has actually increased slightly from the third quarter of last year. This would be consistent with an increase in the number of investors buying units to resell them.
Other recent housing news was also overwhelmingly positive. The number of new homes sold in September was up 27.1 percent from its year-ago level although it is still only a bit more than half of the pre-bubble level. Housing starts were up 34.8 percent from their year-ago level, and starts of single family homes were up by 42.9 percent. And most series show house prices continuing to rise.
The Case-Shiller 20-City index rose by 0.5 percent in August, the 7th consecutive increase. It is now up by 2.0 percent compared with the year-ago level. Prices rose in 19 of the 20 cities. Seattle was the lone exception with a price decline of less than 0.1 percent. The sharpest rise a 1.7 percent increase in Atlanta and a 1.4 percent increase in Phoenix. Even with sharp rises the last four months, prices in Atlanta are still down by 6.2 percent from their year-ago level. By contrast, prices in Phoenix are up 18.8 percent over the year.
The price increases continue to be seen primarily in the bottom tier of the market, especially in the cities hardest hit by the collapse of the bubble. Prices in the bottom tier in Phoenix rose 1.9 percent in August. This actually is a slowdown in a market where prices have risen by 36.5 percent over the last year. Prices for homes in the bottom tier in Atlanta rose 3.7 percent in August and have risen at a 46.2 percent annual rate over the last three months. Prices in the bottom tier of the market in Las Vegas rose 2.1 percent in August and have risen at a 33.6 percent annual rate since August of 2011. Prices for homes in the bottom tier in Minneapolis rose 1.9 percent in August and have risen at a 37.7 percent rate over the last quarter.
The sharp price increases at the lower end of these markets probably should be viewed with some caution. There are accounts in Phoenix and some of the other markets of bidding wars for properties in distressed sales. It is likely that these price increases are being driven by speculators who may not have a clear sense of the market. If that is the case, then it is possible that some of the recent price increases will be reversed in the near future.


