July 31, 2012
July 30, 2012 (Housing Market Monitor)
By Dean Baker
Prices on bottom-tier homes in Phoenix are 25.8 percent above their year-ago level.
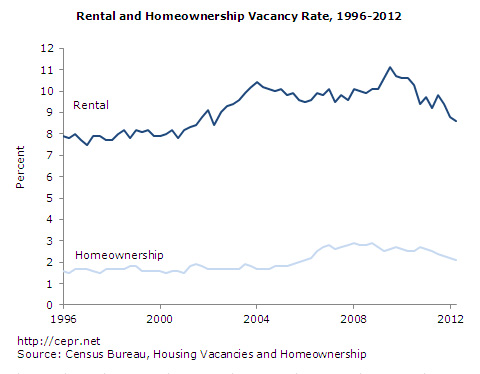
The data released in July provide further evidence of a strengthening housing market. The most notable item among the releases in July was the Census Bureau’s data on vacancy rates for the second quarter. The release showed that the vacancy rates for both rental and ownership units are down in the second quarter. While the size of the drops was not large, the fact that the vacancy rates continued to fall shows that the large drop reported for the first quarter was not a fluke.
The vacancy rate for ownership units fell to 2.1 percent. That compares to 2.5 percent in the second quarter of 2011 and a peak of 2.9 percent in 2008. The vacancy rate for rental units fell by 0.2 percentage points to 8.6 percent. This is down 0.6 percentage points from 9.2 percent in the second quarter of 2011 and more than two full percentage points from the peak of 11.1 percent in 2009. The vacancy rate for rental units has not been this low since 2002. (There are roughly twice as many ownership units as rental units.)
The other housing data released in July were also overwhelmingly positive even though it was not always reported that way in the media. For example, when the Commerce Department reported data on new home sales, most news reports highlighted the reported 8.4 percent decline in sales from the May level. It should have been noted that the May level was by far the highest sales rate since the ending of the first-time homebuyers tax credit. Even though June sales were down from the May level, they were still 15.1 percent above the level of June 2011.
It is also important to realize that these data are highly erratic and subject to large revision. Three quarters of the falloff in June sales came from a 60 percent decline in sales in the Northeast. That sort of month-to-month drop off is not plausible. It is likely that some sales might have been reported in May that actually took place in June. The best way to view the June data would be to take the average of May and June sales. At a 366,000 sales rate, this would tie the weather-boosted February rate for the highest in the last year.
Similarly, news reports highlighted a 5.4 percent falloff in existing home sales in June, failing to note that this followed several months of relatively strong sales. Since existing homes sales, unlike new home sales, are based on actual sales rather than contracts, there is typically 6-8 weeks between a contract signing and a sale. This means that the falloff in June sales is primarily indicating a falloff in April contracts, after the weather boosted the winter sales rate. This should not have been a surprise.
The strength in the housing market is also showing up in the Case-Shiller price index. From April to May, the 20-City index increased by 0.9 percent. Eighteen of the 20 cities showed prices increases, with prices in the other two cities, Charlotte and Detroit, virtually unchanged. Prices in Chicago, which had been falling sharply last fall, rose by 2.3 percent.
Las Vegas and Phoenix, two cities that had been hit hard by the collapse of the bubble, both also saw rapid price increases in May; 1.9 percent and 1.8 percent, respectively. While the turnaround in Las Vegas is recent, prices have risen by 11.5 percent over the last year in Phoenix. This has been driven largely by exceptionally rapid price growth for homes in the bottom third of the market, which has experienced a 25.8 percent rise in prices over the last year.
At this point, it seems impossible to deny that the housing market has hit bottom and is now recovering. This is also showing up in residential construction, which has been a big positive in GDP over the last three quarters. While prices are not about to return to their 2006 peaks, they are likely to again rise at least at the rate of inflation.


