August 13, 2010
August 13, 2010 (Prices Byte)
Energy prices lead 0.3 percent increase in overall inflation for July.
The Consumer Price Index rose 0.3 percent in July, following three months of deflation. Over the last two years since the peak in the CPI, prices have fallen 0.7 percent. The rise in the overall rate of inflation was, in large part, due to a rebound in energy prices, which rose 2.6 percent in July. Core prices rose only 0.1 percent in the month and at a 1.7 percent annualized rate over the last three.
Housing prices rose 0.1 percent in July, despite a 0.6 percent rise in the price of housing fuels. Rent and owners’ equivalent rent—the largest components of housing prices—both rose 0.1 percent in the month, and at a 0.6 and 0.7 percent annualized rate since April, respectively. Despite these small increases, real rent prices are still falling. The prices of rent and owners’ equivalent rent have fallen at a 1.4 percent annualized rate relative to non-shelter core prices over the last three months.
Another large category of prices—transportation—rose 1.3 percent in July, following five consecutive months of decline. Again, this was entirely due to the shift in fuel prices, which rose 4.6 percent in the month (67.7 percent annualized) after falling at a 28.6 percent annualized rate since January.
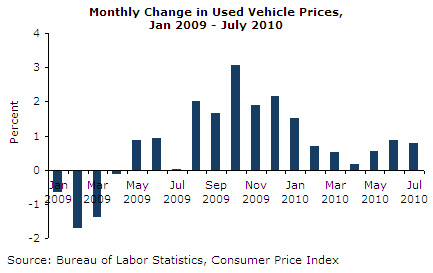
The rate of inflation in all other components of transportation either held or decelerated in July. This includes public transportation, which fell for the second consecutive month. The price of public transportation will likely rebound in coming months—particularly if fuel prices continue to rise. The price of used vehicles decelerated slightly from a 0.9 percent rise in June to 0.8 percent in July. The 9.3 percent annualized rate of inflation over the last three months—while still high—is far below the 32.5 percent rate over the fourth quarter of 2009, when that summer’s cash-for-clunkers program had drained the supply of used cars on the market.

Elsewhere in core goods, apparel prices rose 0.6 percent in July—a 6.6 percent rate of inflation over the last three months, nearly making up for the 7.0 percent decrease from January to April. The price of medical care fell 0.1 percent in July. The fall was relatively broad-based. Though the prices of physician and dental services rose, hospital services and the price of medical care commodities fell 0.2 percent in the month.
Hospital services fell 0.5 percent in July—only the third such fall since 1997. The price of hospital services has risen at an annualized rate of 6.7 percent since January of 1997 and had never fallen more than 0.2 percent in any month.
One other trend worth noting: The price of other goods rose 0.7 percent in July. There has been a continued rise in tobacco and smoking products, which rose 1.6 percent in the month and at an 8.4 percent rate over the last six—likely due to increased taxes as states seek to close their budget deficits.
The July trade data showed non-fuel import prices falling 0.2 percent in the month. There has been no clear trend in recent months, but prices have fallen at a 1.0 percent annualized rate since April. Among the major categories of imported goods, the price of foods and feeds has grown at a 0.5 percent annualized rate over the last three months. Prices of autos and parts have risen at a 1.1 percent rate since April.
Inflation in industrial supplies, which had been decelerating in recent months, rose 0.8 percent in July after falling 3.5 percent in June. This reversal is in large part due to a bounce in fuel prices, which jumped 2.1 percent in the month following two months of declines. Non-fuel supplies actually fell 0.7 percent in the month and at a 4.4 percent rate since April. Prices of capital and consumer goods have each continued to decelerate in recent months and have fallen at 0.4 and 1.1 percent annualized rates, respectively.
Non-agricultural export prices fell 0.2 percent in June—the second consecutive month of declines. Since April, prices have fallen at a 2.3 percent annualized rate.
Despite a few small surprises, the picture for core inflation is largely unchanged. The data point to low inflation in the core with strong price increases driven almost entirely by rising energy prices. There are few sources of price pressure in the economy, as non-fuel import prices continue to fall and the real hourly wage fell $0.02 in July.


