July 27, 2010
July 27, 2010 (Housing Market Monitor)
By Dean Baker
The expiration of the tax credit led to a surge in buying, especially of cheaper homes.
The Case-Shiller 20-City index rose by 1.1 percent in May, its second consecutive increase. Prices rose in 19 of the 20 cities, with Las Vegas being the only city with a price decline.
Minneapolis had the sharpest jump in prices, with prices rising 2.8 percent in May. This is the second consecutive monthly increase after 7 straight months of decline. Atlanta followed the same pattern. Its 2 percent price increase for May followed a rise in April and 7 consecutive months of falling prices.
The West Coast cities all saw substantial gains with San Francisco and Los Angeles leading the group with increases of 1.7 percent each, however prices rose by more than 1.0 percent in all the West Coast cities.
The tiered data indicate that the price increase was largely driven by the tax credit. In most cities, the homes in the cheapest third of the market showed the largest price increases. In Minneapolis, home prices in the bottom tier rose by 4.7 percent, compared with 2.3 percent and 2.7 percent for the middle and top tier, respectively. In Atlanta, prices in the bottom tier rose by 3.3 percent, while prices in the middle tier rose by 1.1 percent and the top tier by 1.8 percent.
In Los Angeles, prices in the bottom tier rose 2.7 percent in May, bringing their annual rate of increase over the last quarter to 15.7 percent. Prices for the bottom tier in Washington, D.C. rose by 2.1 percent and by 1.9 percent in Portland. The respective annual rate of increase for the bottom tier of homes in these two cities over the last three months has been 21.4 percent and 15.9 percent.
The May jump in prices is consistent with a pattern of home buying that was obviously driven by the tax credit. Pending contracts surged in April and plummeted in May, as did new home sales, which also reflect signed contracts. The push to buy homes before the expiration of the tax credit predictably pushed house prices upward. The sales in May reflect contracts signed in March and April before the expiration of the tax credit. The June data will be the first to include a substantial number of homes contracted after the end of the tax credit. Although, even this number is likely to still reflect some price pressure from the California state credit, a credit separate and in addition to the federal tax credit for homebuyers. The California credit will likely support sales in the state into July.
All of the data available since the end of the tax credit suggest that another sharp fall in prices is imminent. Originally, reported May new home sales were at a record low. They were revised even lower with the June report. The June sales data also would have been viewed as a disaster, except for the comparison with the May numbers.
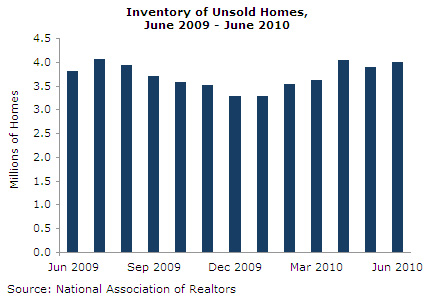
Since the existing home data reflect actual sales, they will not begin to reflect the post-credit weakness until the July data are reported. However, there is already a notable rise in inventories of unsold homes, with the June level just under 4 million. With the rate of sales likely to fall sharply, the backlog of unsold homes will likely exceed 10 months of sales at the July selling rate. This will put substantial downward pressure on prices. The record housing vacancy data reported for the second quarter also supports the view of a housing market with considerable downward pressure on prices.

The data also show another sharp drop in homeownership rates, with the overall rate falling to 66.9 percent, the lowest level since the 4th quarter of 1999. The group with the sharpest decline was for Hispanics, who saw their homeownership rate fall from 48.5 percent in the second quarter of 2009 to 47.8 percent in the second quarter of 2010. This is a drop of 2.3 percentage points from the peak of 50.1 percent in the first quarter of 2007.
This report is likely to lead many analysts to claim that prices are moving upward and that the housing market has stabilized. This will lead them to be surprised when data in the second half of 2010 shows sharp price declines.


